In case you doesn’t know what Buddhabrot is, quote from wiki:
The Buddhabrot is a map related to the Mandelbrot set. Its name reflects its similarity to classical depictions of Gautama Buddha, seated in a meditation pose with a forehead mark (tikka) and traditional topknot (ushnisha).
Mandelbrot set is a well-known fractal:
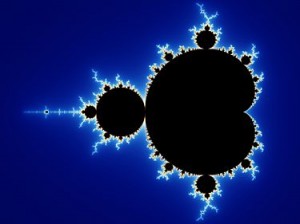
source: Wikipedia.org
If you don’t know it or you’ve never heard of fractals at all, you probably won’t feel true awesomeness of Buddhabrot, but you may still enjoy pictures, so carry on ;)
Buddhabrot is a technique of rendering Mandelbrot set, developed by Melinda Green in 1993. For full math and story explanation visit http://www.superliminal.com/fractals/bbrot/bbrot.htm or Wikipedia page.
I was really excited about this, so I took some algorithm I’ve found and re-implemented it in JavaScript. Unfortunately my math is not good enough, so I couldn’t do it by myself. In fact I still don’t understand few things that happen here. But I optimized it a bit and used Google Closure math library.
Originally it produces grayscale image as a result, so I implemented a coloring technique similar to what NASA does with Hubble photos.
You can try it on github (beware, it’s very CPU consuming!):\ http://fridek.github.com/buddhabrot/
Here is example result of my script, after 2800 iterations:
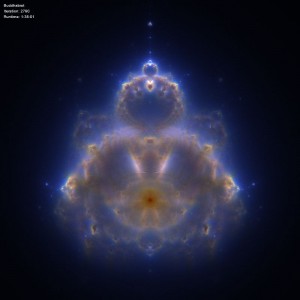
Click to enlarge
It took 1h30m to render with 800×800 resolution. It probably can’t improve anymore without using bigger canvas.
Now I’m thinking about implementing it as a WebGL texture and calculating each iteration with shaders. It would be both awesome and blazing fast, so wish me luck!
Oh, and here is original statue of Buddha, so you can compare how similar it is
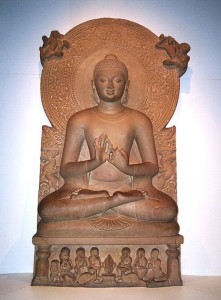
source: Wikipedia.org
And this is a true power of math!